Notes on altitude
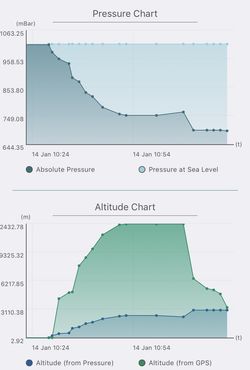
I now have some data about how planes work when landing in high places. This chart shows our journey from Lima to Cusco, starting at sea level and landing at around 3300m. After takeoff, the cabin pressure drops gradually to around 750 millibars at cruising altitude. Once the pilot announced that we were descending, the pressure dropped gradually again, to around 700 mbar. They then let another few mbar out quite quickly while we were taxiing to the terminal - this isn't shown terribly well on the graph, but you can just about see that the final points on the altitude chart don't quite overlap fully.
Does anybody know whether there are standards for cabin pressure? I think that 750 mbar cabin pressure seems to be more or less typical, and perhaps the drop to 700 mbar during the final descent is considered to be acceptable when the pressure at the destination is below that, but I don't have a lot of data to back that conjecture up.
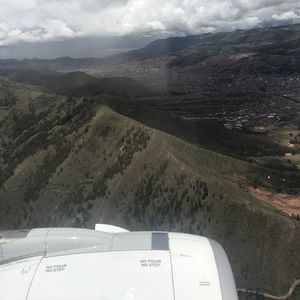
The final approach into Cusco is quite amazing. Our plane went around Huanacauri, the smallish mountain in the foreground (although not really that small: the peak is 4089m, around 700m above the city) then took a sharp left and dropped like a stone to land. The airport is surrounded by houses, and has a remarkably long runway so that aeroplanes can get a good run-up to take off. It's somewhat reminiscent of the old Kai Tak airport in Hong Kong, in that you can look up out of your window while landing and see hills and houses well above you. And, like Kai Tak, it seems as though it's going to be replaced: they're building a new airport at Chinchero, half an hour out of town and over 400m higher.


Somewhere in the background is Sacsayhuamán, an Inca citadel that sits at around 3700m and has a wonderful view of the aeroplanes coming in to land just a couple of miles away, as well as magnificent stonework.
We flew back to Lima from Juliaca, the highest airport in Peru and (according to Wikipedia) the ninth highest commercial airport in the world, at a literally breathtaking 3826m above sea level. That's around 648 mbar - so there's just under two-thirds of what I'd consider a normal amount of oxygen in each breath. Straight after takeoff (or possibly even just before, when the engines were spooled up to full power) the cabin pressure started increasing steadily until it reached 760 mbar around 20 minutes after takeoff - so much like a normal flight, except that the pressure increased rather than decreased at the beginning. The landing was like any other, with the pressure gradually increasing back to sea level as we descended.
I took the readings with an iPhone app called Bar-o-Meter. It’s free, and is just functional enough for me not to go searching for an alternative. It would be much better if it was possible to export the raw data as CSV, and also if it could be set up to take periodic readings. It does have a “Trend” display (which is where the graph came from) that says it records data every 2 minutes, but this doesn’t seem to be true: I had to keep waking my phone up every so often in order to get it to take a new sample. Still - definitely worth every penny I paid for it.